From Analyst Workflow to Investment Intelligence
I built a research infrastructure platform that turns fragmented digital-asset analysis into a structured, explainable and repeatable investment workflow.
Built from a problem I experienced firsthand—from an investment framework developed in 2021, through productization at BitBNS / Chaos Ground, to an independent platform and real-world portfolio testing.
Analyst Leverage Limit
An exploding digital assset/token universe created 30–40 hrs/week of manual spreadsheet scraping, subjective memory, and lost institutional context.
Codified Research OS
Engineered 7 weighted pillars into normalized 0–3 metric ratings, automated scheduled ingestion, and introduced team review queues.
Real-World Capital Test
Tested the framework with skin in the game: +136.05% return across 30 assets, with top 5 positions driving 63% of alpha through concentration.
The bottleneck wasn't lack of data. It was analyst leverage.
Every digital asset team has access to price feeds and APIs. The breakdown occurs in structuring judgment and maintaining context across a growing asset universe.
Fragmented Diligence
- Data scattered across 12+ disconnected websites and dashboards
- 30–40 hours/week spent on repetitive manual data collection
- Analyst-dependent subjectivity with unstandardized scoring
- Research conclusions difficult to compare or audit over time
- Lost context when analysts left or market regimes shifted
Capacity Saturation
- A rapidly expanding asset universe (10,000+ tokens/digital assets)
- Exponentially more diligence work than human analysts can absorb
- Superficial analysis replaces rigorous fundamental research
- Firms forced to choose between narrow coverage or shallow rigor
The Guiding Directive
"To preserve human judgment while automating the repetitive work surrounding it."
The objective was never to replace analysts with a black-box trading algorithm. The goal was to build an analyst exoskeleton: automating data ingestion, standardizing evidence collection, and giving analysts the infrastructure to make explainable decisions at scale.
The platform didn't start as a platform.
A multi-year continuum from manual evaluation frameworks to exchange-scale digital asset/token diligence, independent system productization, and 2026 agentic workflows.
The Framework
How do we systematically evaluate a universe of 1,000+ digital assets without emotional bias? Formulated the original 7-pillar evaluation rubric.
Manual RubricBitBNS Scale
Operationalized digital-asset evaluation into a repeatable exchange-grade workflow, reviewing project viability, security, and market liquidity.
Exchange OperationsChaos Ground
Transitioned from spreadsheets to productization: weighted multi-metric algorithms, automated scheduled ingestion, and historical score tracking.
ProductizationIndependent Platform & AI Agents
Rebuilt the system from the ground up as a multi-tenant research operating system with RBAC, analyst review queues, and telemetry logs—now exploring governed AI agents as active research partners for autonomous evidence synthesis and thesis monitoring.
Platform OS • AI AgentsThe result: A research operating system, not just a score.
Explore the 6 core functional layers designed to take an investment team from macro universe monitoring to auditable, team-wide diligence.
Codify The Investment Thesis
Transforming subjective analyst opinions into a disciplined, versioned evaluation taxonomy.
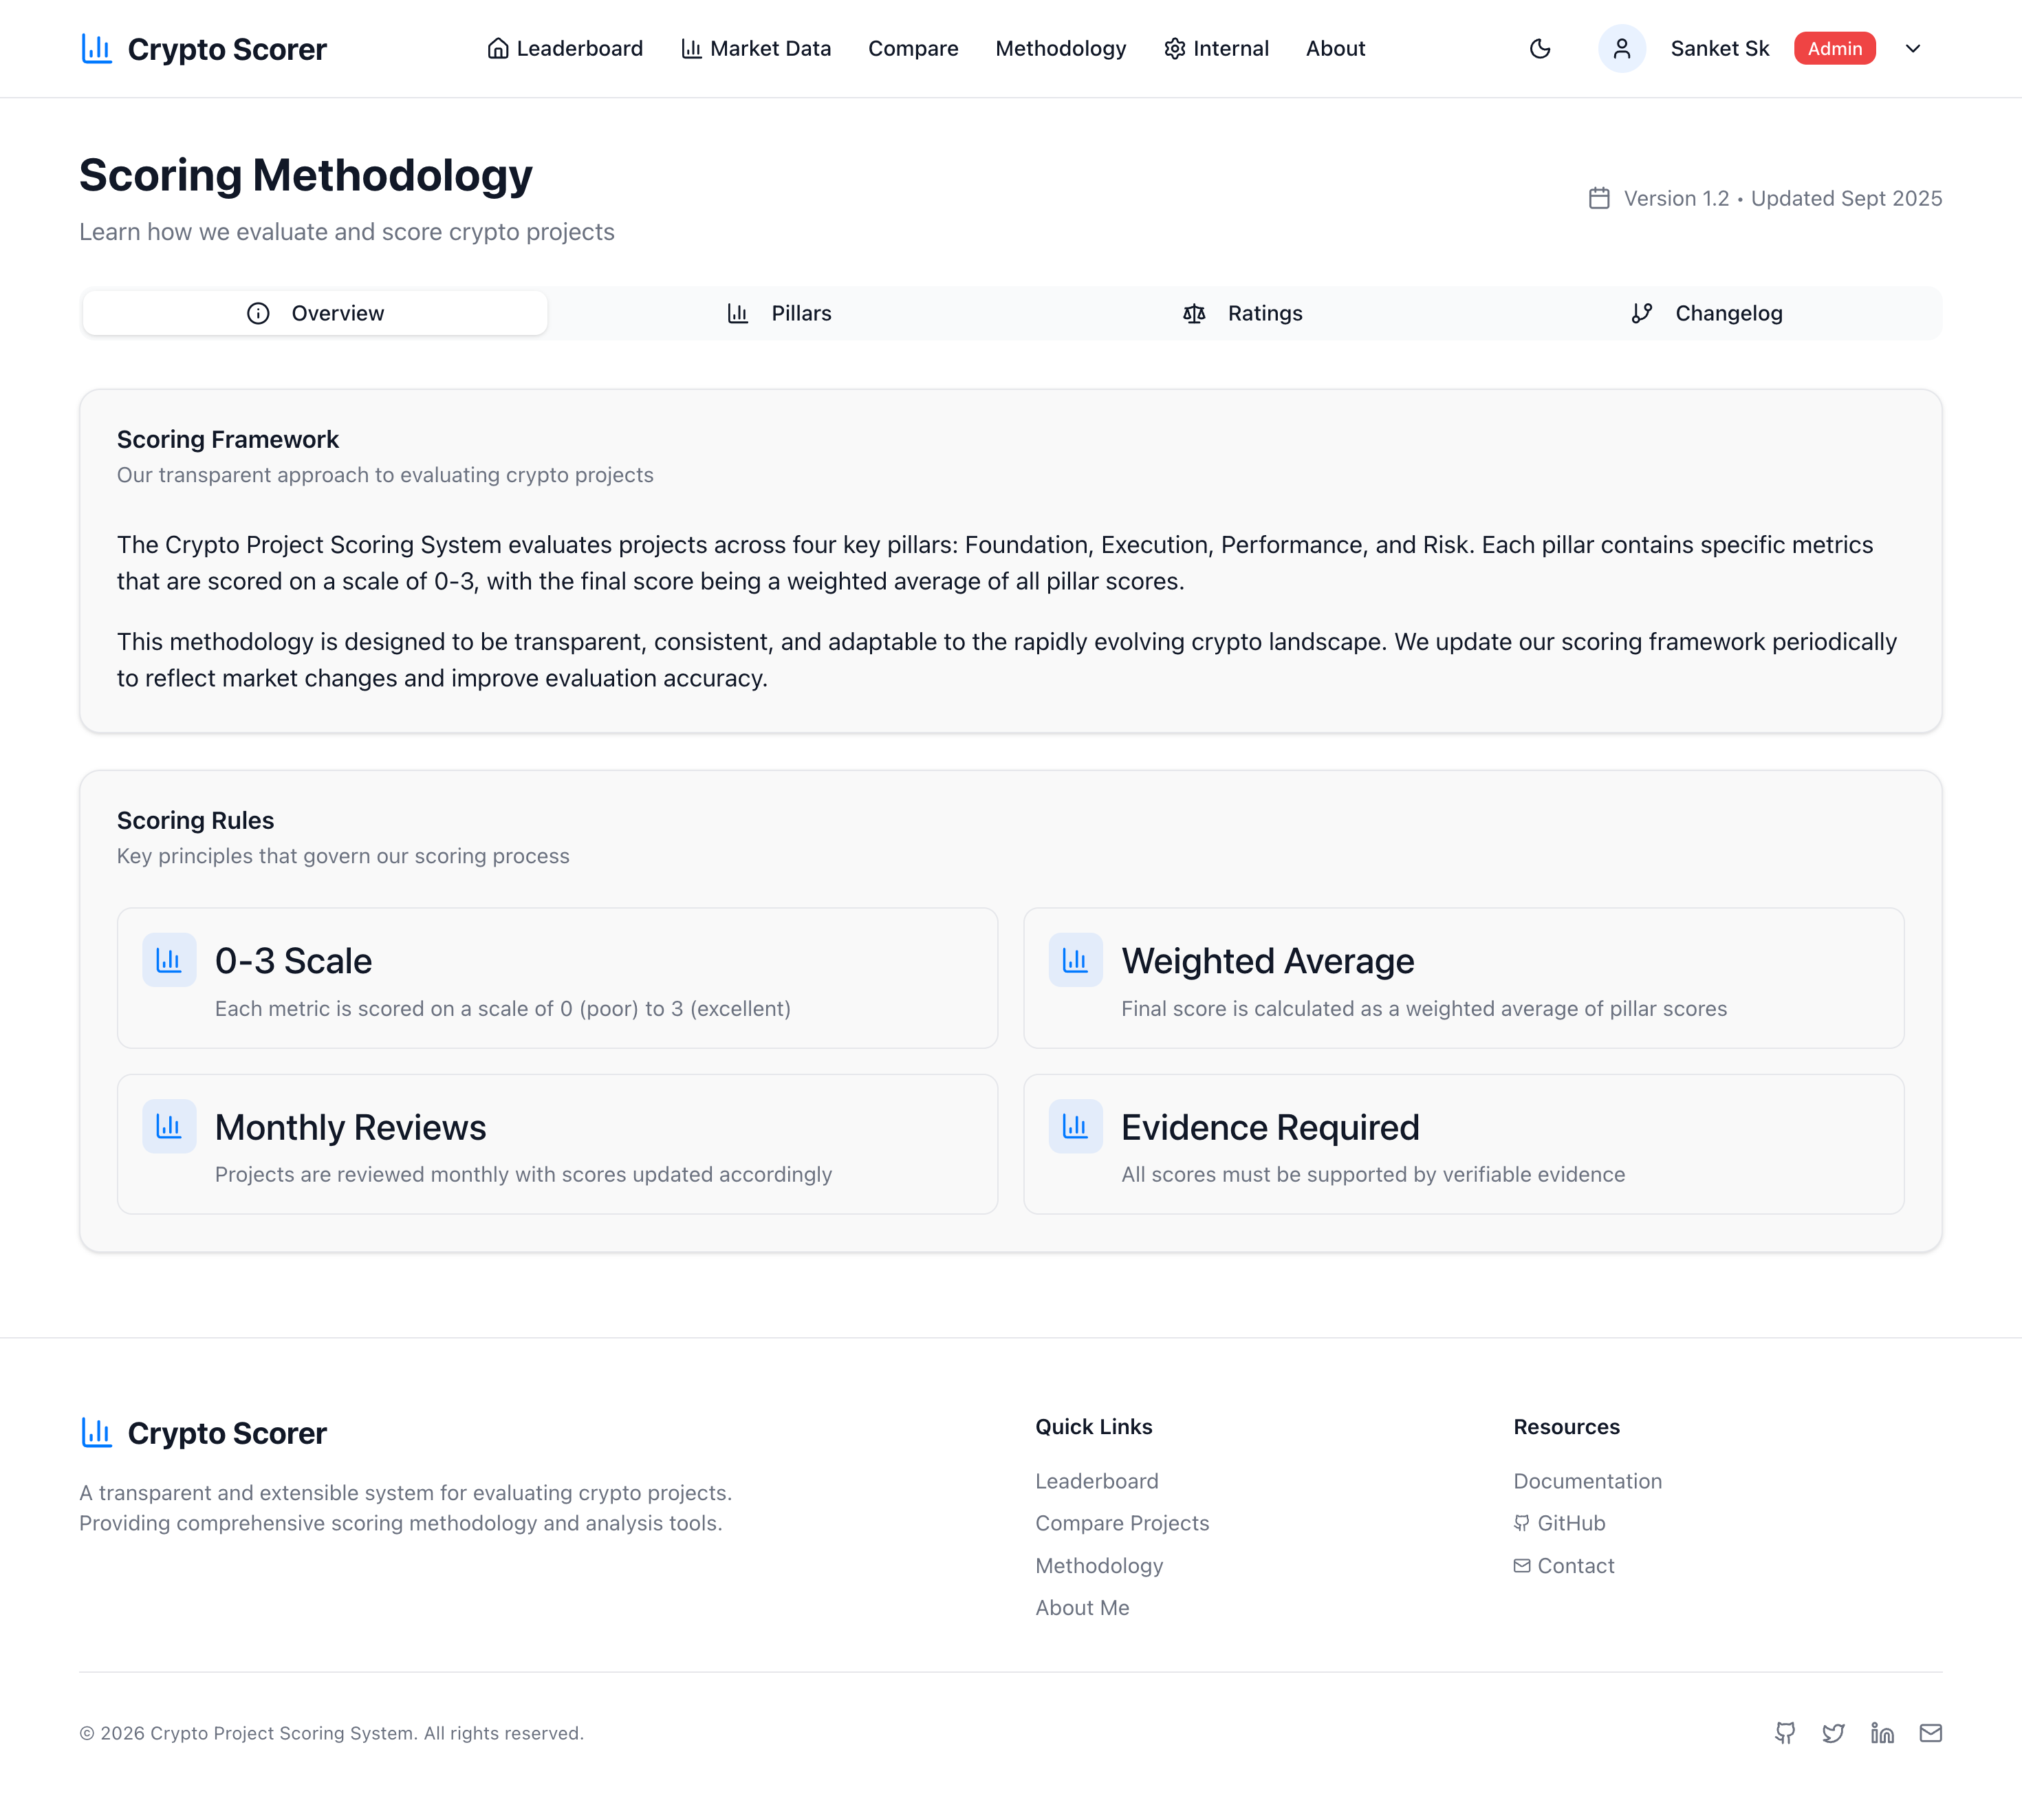
- 0–3 Normalized Metric Scale: Evaluates qualitative & quantitative fundamentals with strict evidence verification.
- 7 Weighted Research Pillars: Foundation, Technology, Adoption, Security, Tokenomics, Community, Market.
- Methodology Versioning: Preserves historical analytical frameworks so models can be backtested across market regimes.
Make investment judgment explicit.
How unstructured qualitative claims and on-chain raw telemetry are transformed into auditable scores, transparent rating bands, and monthly human reviews.
Raw Evidence
GitHub commits, audits, TVL, volume, token lockups, foundation docs.
0–3 Metric Grading
Strict rubrics normalize qualitative and numerical metrics to 0–3.
Pillar Aggregation
7 Pillars rollup sub-metrics based on institutional weights.
Weighted Score
Calculates transparent composite score (0–100) with history tracking.
Rating Bands
Classifies assets into illustrative prototype bands for risk tiering.
Human Decision
Analyst validates context, adds qualitative memo, and confirms sizing.
Monthly Reassessment
Automated alerts flag deteriorating fundamentals or score shifts.
Illustrative Rating Bands
The platform utilizes prototype rating classifications to demonstrate risk tiering. The system is designed to structure and explain analytical judgment; it is not presented as an automated retail buy/sell recommendation engine.
Adaptable To Proprietary Firm Theses
The platform does not enforce a rigid intellectual worldview. The architecture is modular: any fund can configure its own custom pillars, sub-metric formulas, evidence criteria, and risk tolerances.
What does the system actually help an analyst do?
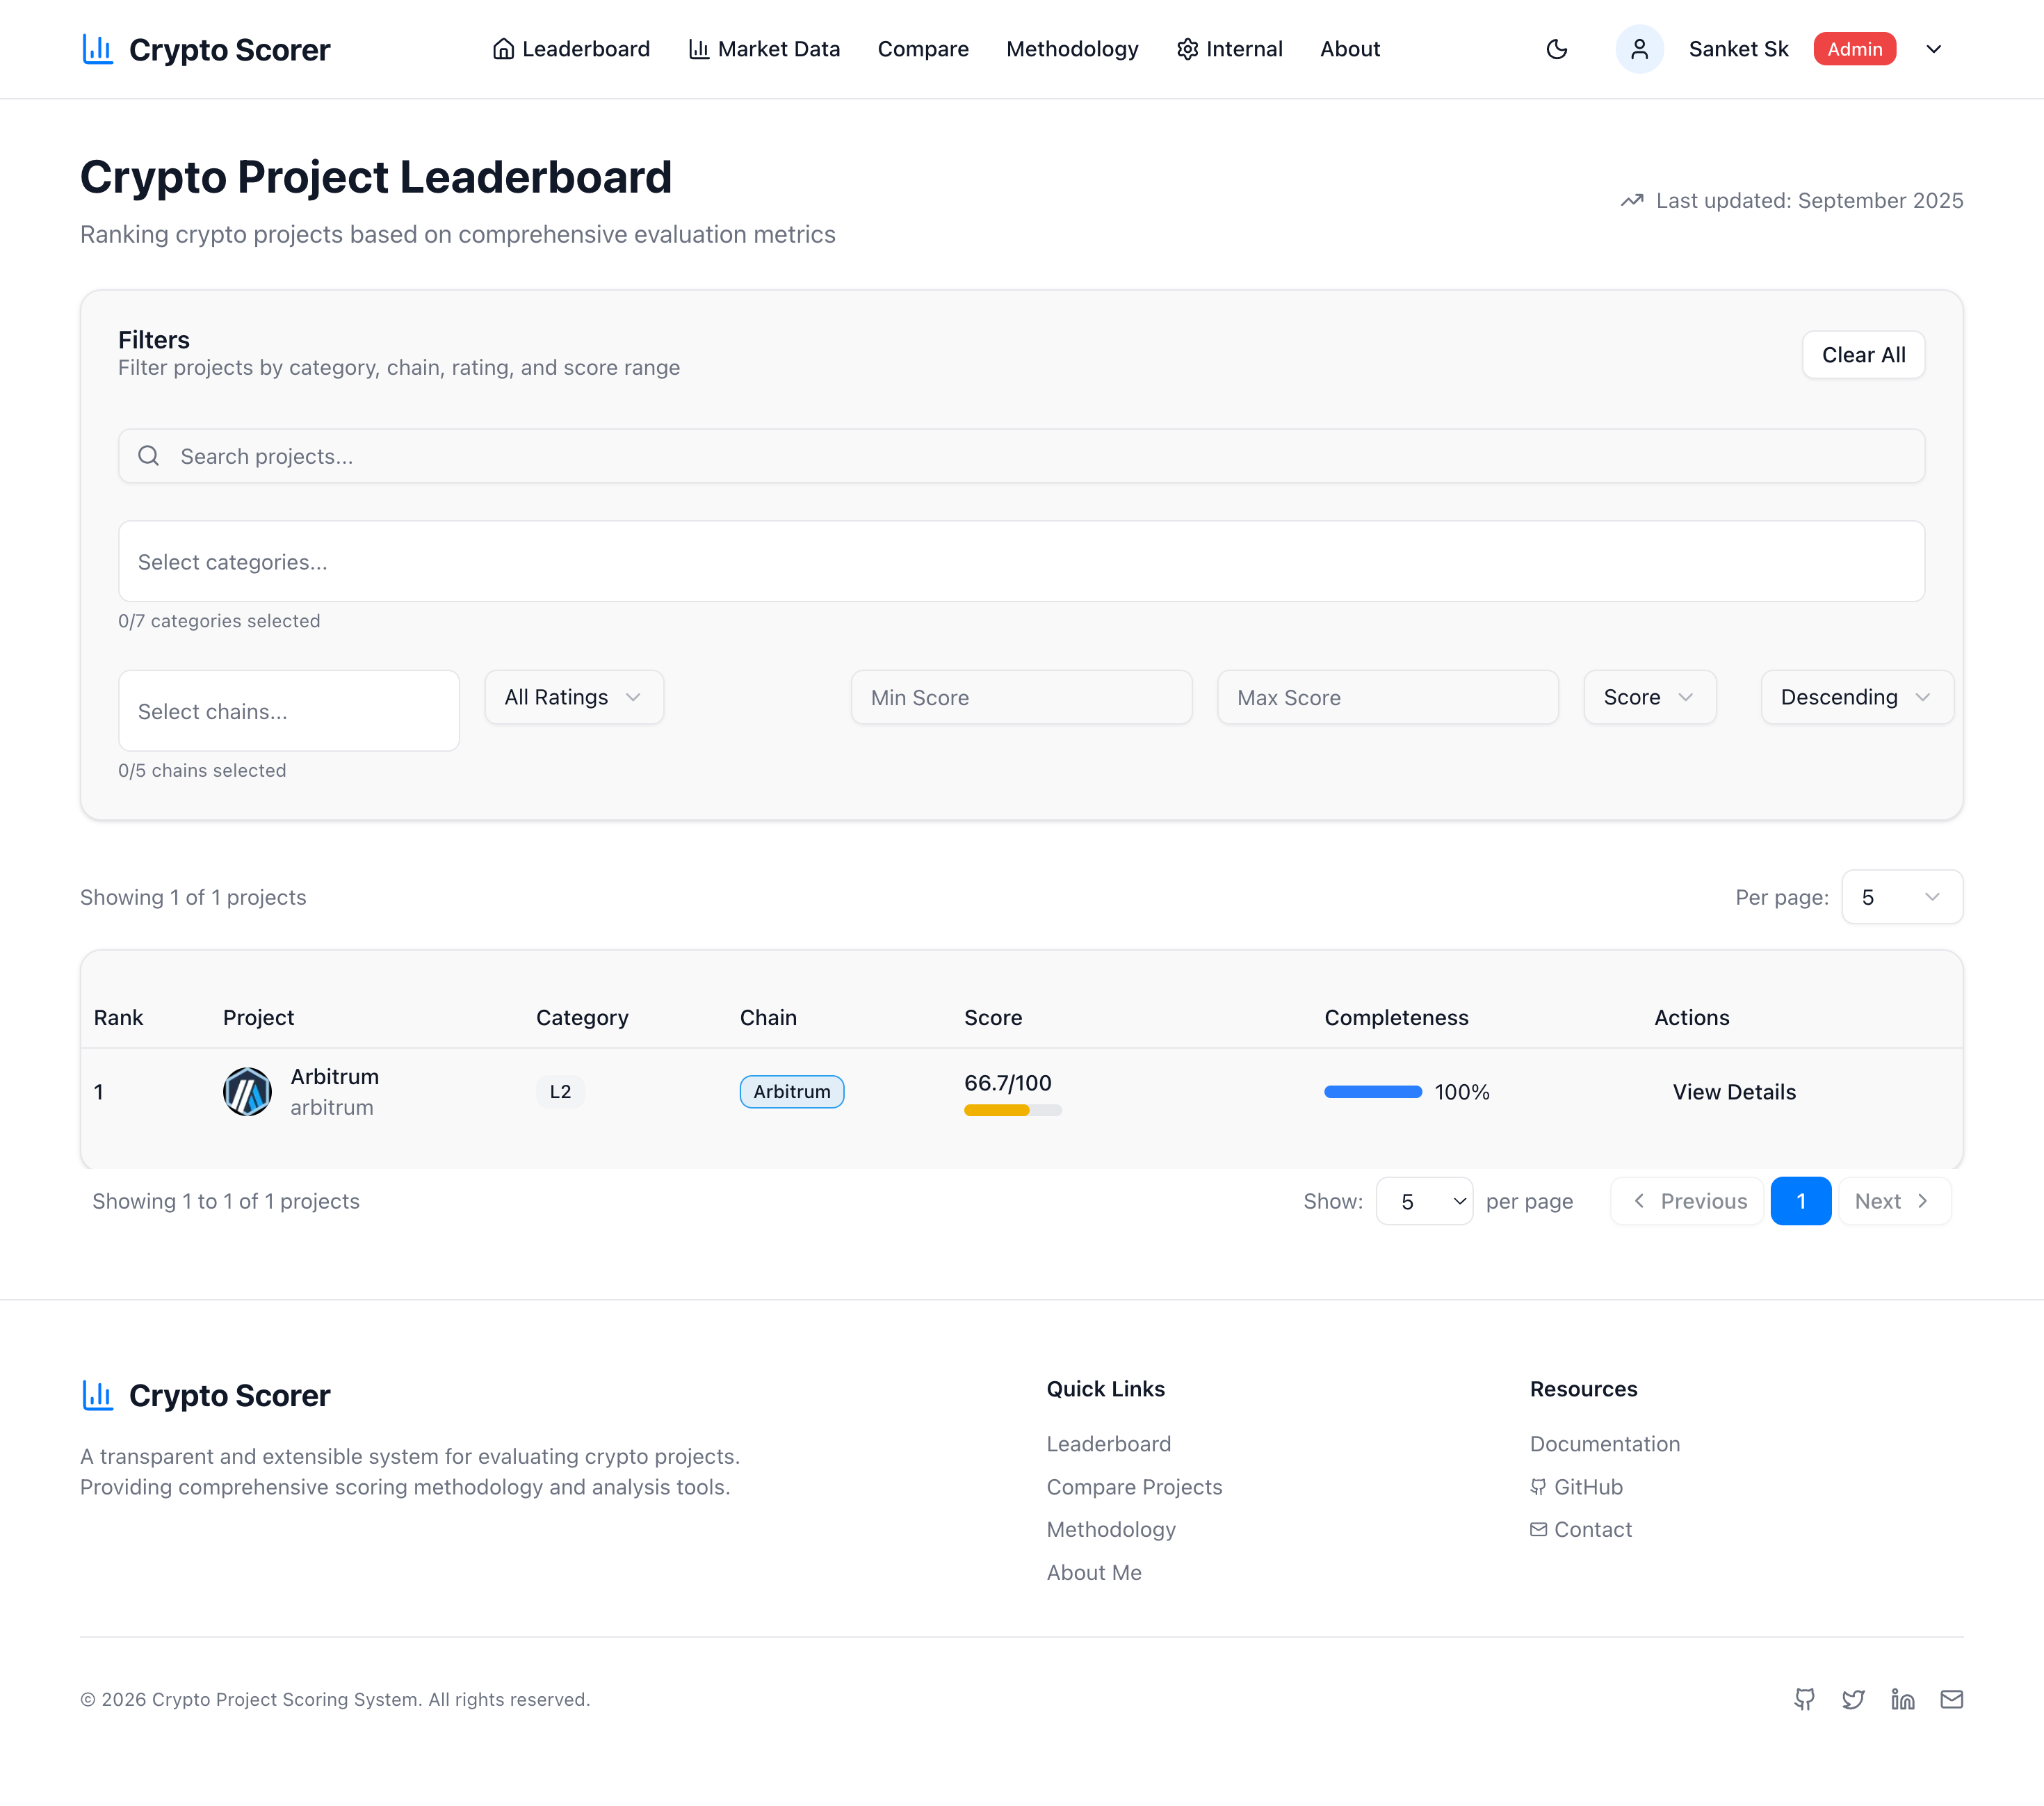
A walkthrough of Arbitrum (ARB): from raw market context to fundamental diligence, pillar deconstruction, and qualitative analyst sign-off.
From Context to Auditable Verdict
Illustrative Worked Example: Arbitrum is demonstrated to show how the system structures raw evidence into an explainable score (66.7 / 100). Individual asset scores and pillar weights adapt dynamically to each firm's investment philosophy.
I productized a research workflow, then ran it against live decisions.
Tested the research framework with skin in the game across an actual portfolio, maintaining transaction-level records of decisions made under the framework.
Decisions Made Under The Framework
Research decisions through the cycle
Top 5 Conviction Gain Contributors
62.9% of Total GainsThe system taught me as much as it measured the market.
Three principles derived from operating research systems across market volatility and product iterations.
Frameworks beat intuition at scale
In fast-moving markets, individual intuition is vulnerable to FOMO, recency bias, and fatigue. A codified framework creates an emotional circuit-breaker, ensuring every asset is judged against identical standards regardless of hype.
Automation should remove work, not judgment
Automating judgment leads to fragile black boxes. Automating data collection, schema normalization, and review alerts frees analysts to focus entirely on thesis validation and qualitative edge.
A good score is not an investment thesis
A high score tells you a project looks structurally sound today. An investment thesis defines why the market underprices it and what specific variables would invalidate the position. Product readiness and market readiness are distinct disciplines.
Next: from research workflow to AI research partner
The transition from a structured analyst workflow to autonomous agents that act as analysts' high-leverage partners.
Operational Infrastructure
- Scoring framework & 7 weighted pillars
- Universe market data & category rollups
- Automated scheduled data adapters
- 6-month score history & trendlines
- Analyst review queues & monthly cadence
- Multi-tenant role-based access (RBAC)
Governed AI Agents
Human in the Loop
The goal is not to replace 10 analysts with an unsupervised chatbot. It is to increase the depth, velocity, and quality of research one analyst can deliver.
"Human owns the decision.
AI expands the analyst's capacity."
Let's Connect
I'm interested in working on products where the underlying problem is technically difficult but the experience needs to feel simple.
That could be financial infrastructure, payments, APIs, developer platforms, or complex B2B workflows. I'm also interested in teams using AI to make products and operations meaningfully better—not just adding AI because it's available.
I tend to do my best work when there is a real problem to untangle, enough ownership to make decisions, and a team that cares about getting the details right.
If you're working on a difficult product problem around APIs, financial infrastructure, developer experience, or complex B2B workflows, I'd be happy to compare notes.
I'm also always interested in talking to people who are building products, hiring product leaders, or thinking about how AI changes the way products get built.